


The short version
- 01
Centi was the first full-stack application I built outside of school. I started it near the end of my final semester at UCF because I wanted to stay sharp after senior design, get better at styling real interfaces, and build something I would personally use.
- 02
At the same time, I was trying to understand my spending before graduating. I had previously used Mint, but once it shut down I no longer had one clear place to look at my accounts and transactions. Combining those two problems gave me the project.
- 03
The first version was extremely basic. I experimented with uploaded transaction files and regular expressions, then discovered Plaid and started rebuilding the app around connected financial data. A large part of the project became learning how to organize messy transaction information into a dashboard that was simple enough to read without hiding the detail underneath it.
The problem
Banking apps are good at showing what happened inside one account, but they do not always give a useful picture of how money is moving across everything together.
The data itself is also inconsistent. Merchant names are messy, transfers can look like spending, and one purchase can arrive with very little context. The real problem was not displaying transactions. It was making the information feel understandable.
What I built
- Plaid account linking and financial data import
- CSV upload flow for unsupported or historical data
- Manual cash transaction entries
- Transaction cleanup and categorization
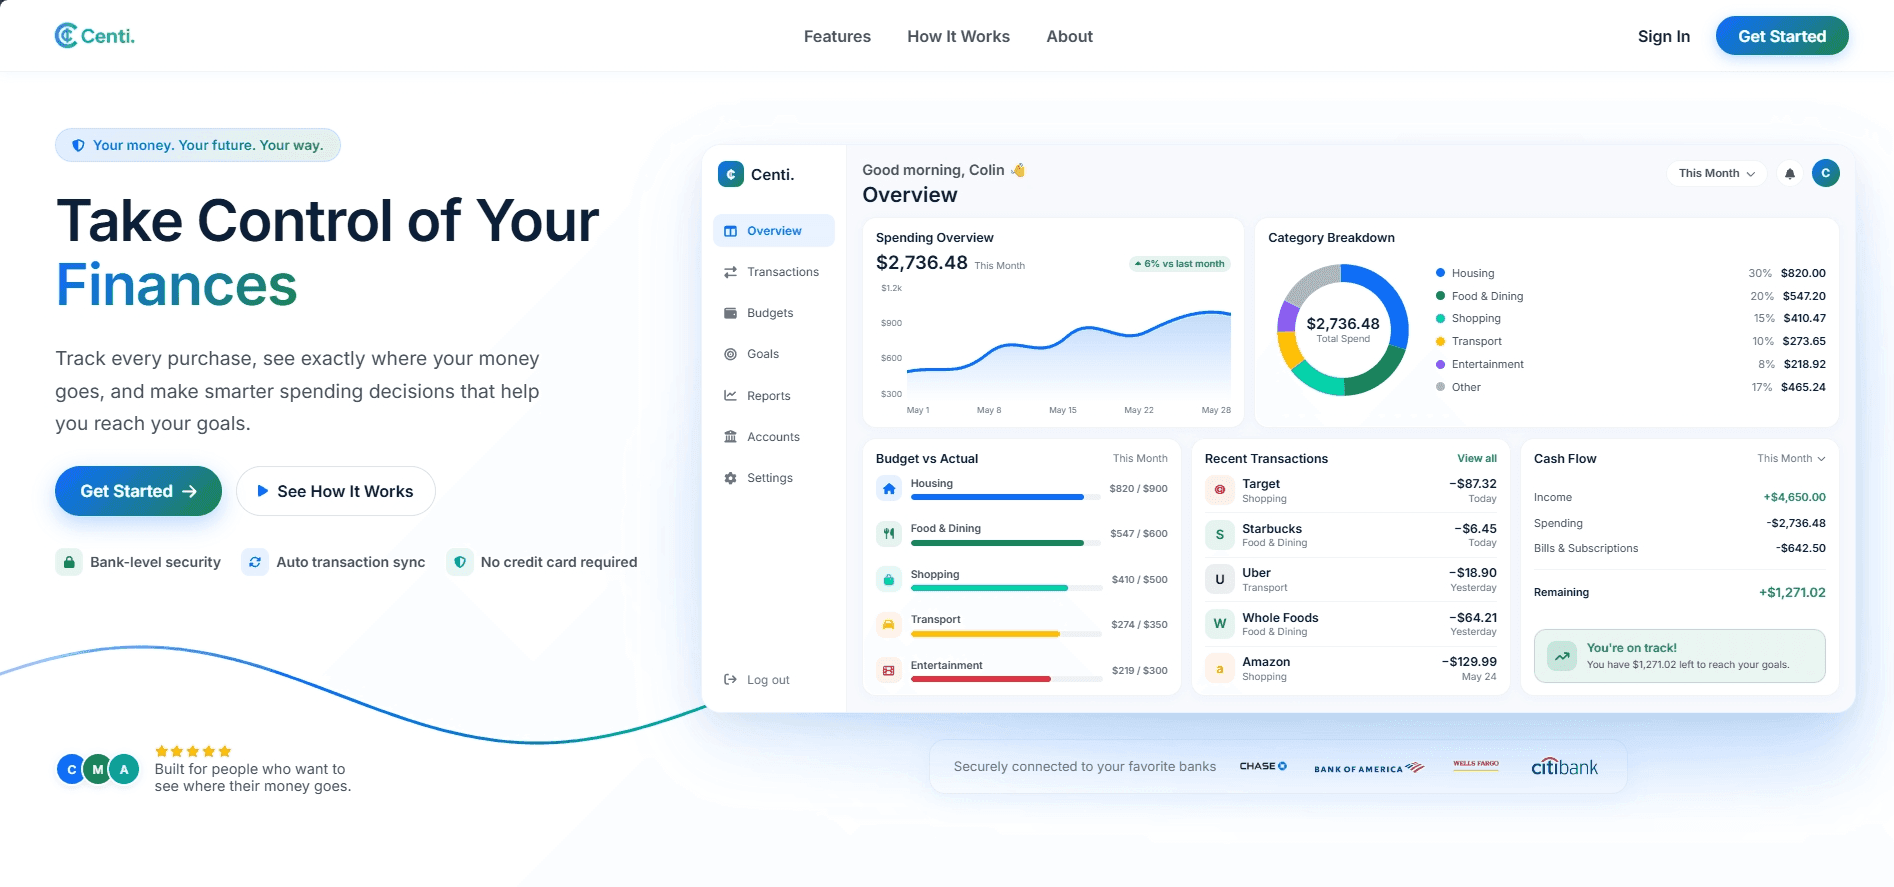
- Spending summaries, trends, and monthly comparisons
- Centi Score concept for a simpler financial snapshot
- Google OAuth and account authentication
- Email verification and password reset flows
- Separate frontend, API, and database deployments
Design decisions
I treated the dashboard like an explanation layer instead of trying to fit every possible number onto the first screen. The overview should answer where the money is going and what changed before the user has to inspect individual transactions.
I kept the visual language fairly calm because financial products can become stressful quickly. The interface needed to feel useful and readable, not like it was constantly warning the user that every purchase was a mistake.
Technical decisions
React handles the interface, FastAPI serves the application and integration logic, and PostgreSQL stores accounts, transactions, users, and categories.
Plaid became the main source for connected account data, but I kept CSV and manual entry paths because a personal finance view is incomplete if it can only understand one provider.
The frontend is deployed through Vercel, while the API and database run through Railway. Building those pieces separately forced me to learn much more about authentication, environment configuration, cross-origin requests, and production deployment than a local school project would have.
Challenges
The data was harder than the dashboard. Merchant cleanup, duplicate handling, transfers, refunds, and categories all create edge cases that are easy to ignore until the app starts using real transactions.
It was also my first time owning the entire application outside a class project, so every missing piece became mine to solve, including authentication, deployments, API failures, database changes, and the design itself.
The outcome
Centi became a working personal finance product and the project that moved me from building assignments to thinking through a full application as one connected system.
Centi runs account syncing, categorized spending views, and a health summary on one deployed stack, covering API integration, data modeling, authentication, and the quieter work required to make a dashboard feel trustworthy.
What I'd improve next
The next version would improve categorization by learning from user corrections, add clearer forecasting, and make the main spending story feel even more immediate on mobile.

Let's Talk
Want something like this for your business?
Whether it's a website, a system, or an idea that still feels a little messy, I can help you figure out what makes sense next.